
Aviation weather fundamentals
Altitudes and flight levels in aviation
Why AGL, AMSL and FL describe different quantities, how altimeter settings work, and which level to use in a weather model.
An altitude needs more than a number. Check its unit, reference surface and method of measurement.
Where does the height start?
“300 m” is incomplete. It could describe height above local ground, altitude above sea level, or a barometric indication. Sharing a unit does not make those quantities interchangeable.
| Notation | Reference | Meaning |
|---|---|---|
| AMSL / MSL | Mean sea level | 1200 m AMSL uses a common sea-level reference. Precise comparisons require compatible vertical datums. |
| AGL | Local ground surface | 600 m AGL is the distance above terrain at this particular point. |
| AAL | Aerodrome level | 900 m AAL is above the aerodrome reference level; terrain along the route may differ. |
| FL | Standard barometric scale | Hundreds of feet with STD 1013.25 hPa set. Not a geometric distance above sea or ground. |
How an altimeter obtains altitude
A barometric altimeter measures static pressure and converts it to altitude using a standard atmospheric model. It does not measure distance to the surface. The pressure setting establishes the reference for its indication.
ISA sea-level reference conditions are 1013.25 hPa and +15 °C. Temperature decreases by 6.5 °C per kilometre up to 11 km; from 11 to 20 km it is −56.5 °C. The real atmosphere differs from this model.
Static pressure → standard barometric scale + pressure setting → altitude indication
QNH, QFE and STD: what changes?
Consider a serviceable altimeter at an aerodrome with an elevation of 300 m. Changing the setting changes the reading while the aircraft stays in place.
| Setting | What is set | Expected reading |
|---|---|---|
| QNH | Aerodrome pressure reduced to MSL using the standard atmosphere | About 300 m, the aerodrome elevation. In flight this is barometric altitude on QNH. |
| QFE | Pressure at the selected aerodrome or runway-threshold reference level | Approximately zero at that level. In flight it is not height above changing terrain. |
| STD | Standard pressure, 1013.25 hPa | The aerodrome pressure altitude on the standard scale. |
Flight levels and pressure surfaces
FL350 denotes 35,000 ft on the standard barometric scale with STD 1013.25 hPa set: 10,668 m on that same scale. The corresponding pressure is about 238.4 hPa; the true altitude of the surface depends on the atmosphere.
With identical lower reference conditions, a layer between two pressures is thicker in a warm air column than in a cold one. The 500 hPa surface can therefore rise or fall while retaining an equivalent of approximately FL183.
| Pressure | Pressure altitude | Equivalent FL |
|---|---|---|
| 850 hPa | ≈ 1457 m | ≈ FL048 |
| 700 hPa | ≈ 3013 m | ≈ FL099 |
| 500 hPa | ≈ 5574 m | ≈ FL183 |
| 300 hPa | ≈ 9164 m | ≈ FL301 |
| 250 hPa | ≈ 10,363 m | ≈ FL340 |
| 200 hPa | ≈ 11,784 m | ≈ FL387 |
Transition altitude and transition level
Transition altitude (TA) is an altitude; transition level (TL) is a flight level. The airspace between them is the transition layer. They are different boundaries.
- In a climb, change from the applicable local pressure setting to STD when crossing the transition altitude, then use flight levels.
- In a descent, change from STD to the setting required by local procedures when crossing the transition level.
- Check TA/TL and setting procedures in the current AIP, aerodrome charts, ATIS and ATC instructions.
Why indicated and true altitude differ
| Cause | Effect | What to consider |
|---|---|---|
| QNH setting too high | The altimeter reads higher than with the correct setting. | Check current pressure, units and the selected setting. |
| Air colder than standard | True height above the reference level is lower for the same indication. | Correct QNH does not compensate for this effect. Use approved temperature-correction procedures. |
| Instrument and static system | Instrument and position errors affect the measurement. | Observe equipment operating limitations. |
Radio altitude, GNSS and geopotential height
A radio altimeter uses a reflected radio signal to provide height-above-surface information within its operating limits. Its reading relates to local terrain; QFE relates to a fixed aerodrome reference.
GNSS determines position relative to a reference ellipsoid. A receiver may additionally report a height corrected using a geoid model. Check which value it actually displays.
H ≈ h − N: height above the geoid ≈ ellipsoidal height − geoid height
Illustrative example: h = 520 m, N = +30 m → H ≈ 490 m
Z = Φ / g₀: geopotential height
Reading NOAA GFS levels
Parameter and level are separate parts of a record. TMP : 850 mb : 3 hour fcst is a temperature forecast on the 850 hPa surface, valid three hours after the model run. Temperature is in K; subtract 273.15 for °C. 1 hPa = 1 mb = 100 Pa.
| Level / record | Meaning | What to check |
|---|---|---|
| 850 hPa; HGT:850 hPa | A pressure surface; its geopotential height | Use HGT for the same coordinates, run and valid time as the other fields. |
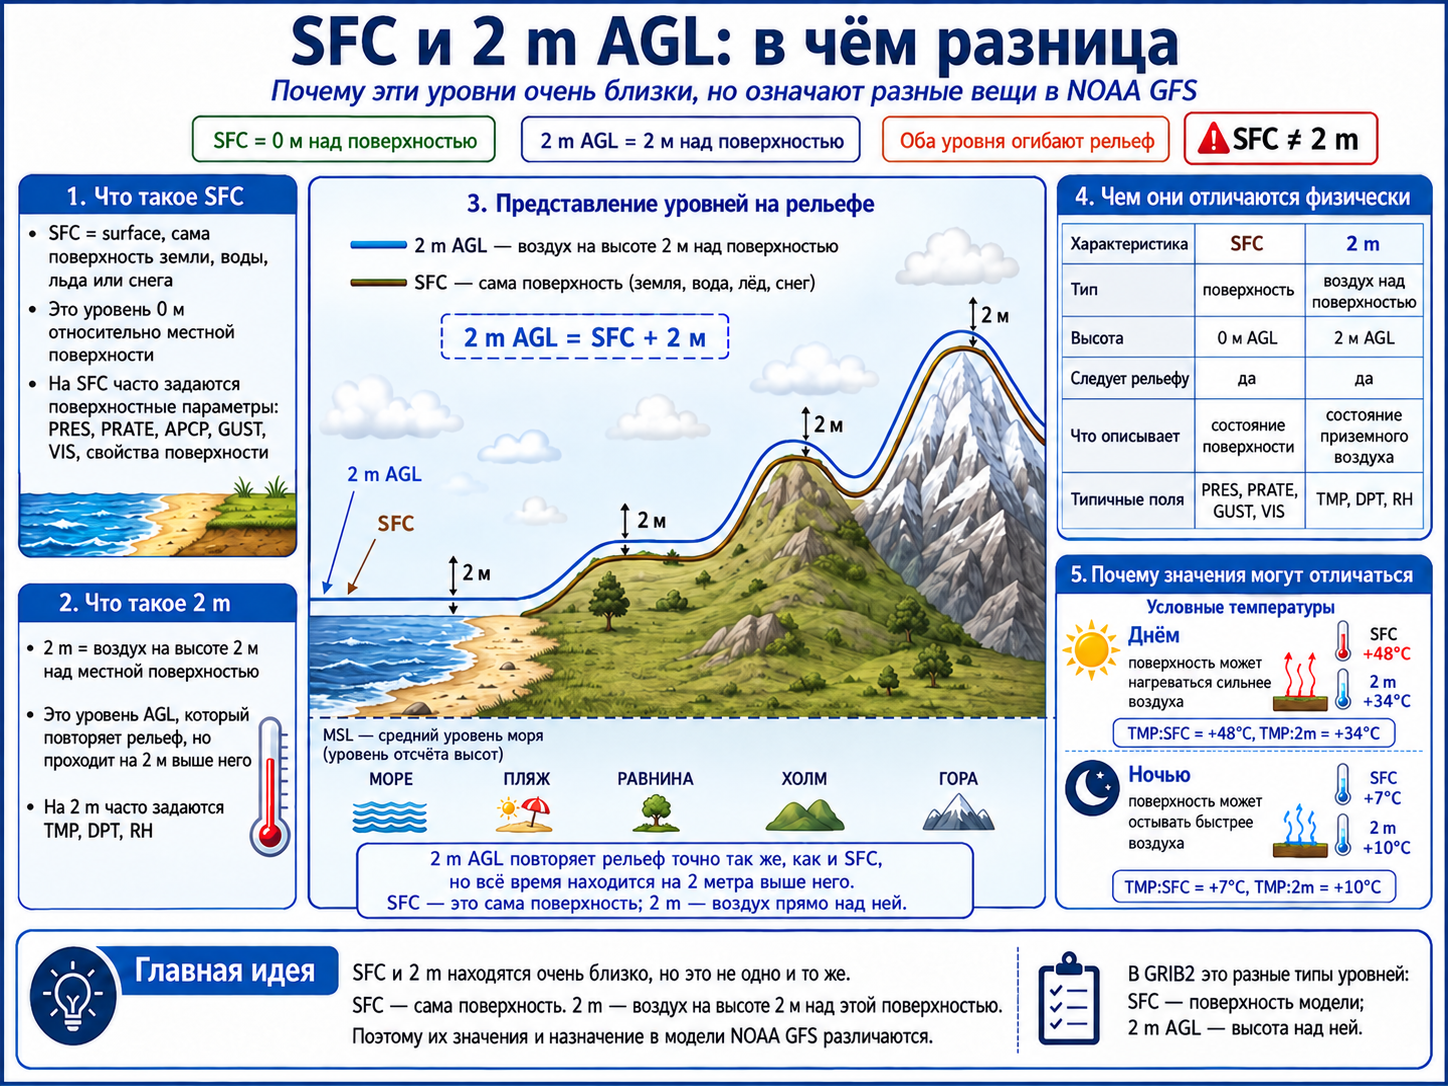
| SFC / surface | The model surface | Surface temperature differs from air temperature at 2 m. |
| 2 m / 10 m above ground | Height above the model surface | Common air-temperature and near-surface wind levels. Model terrain may differ from a DEM. |
| mean sea level | Mean sea level as a reference surface | PRMSL is reduced pressure, not local surface pressure. |
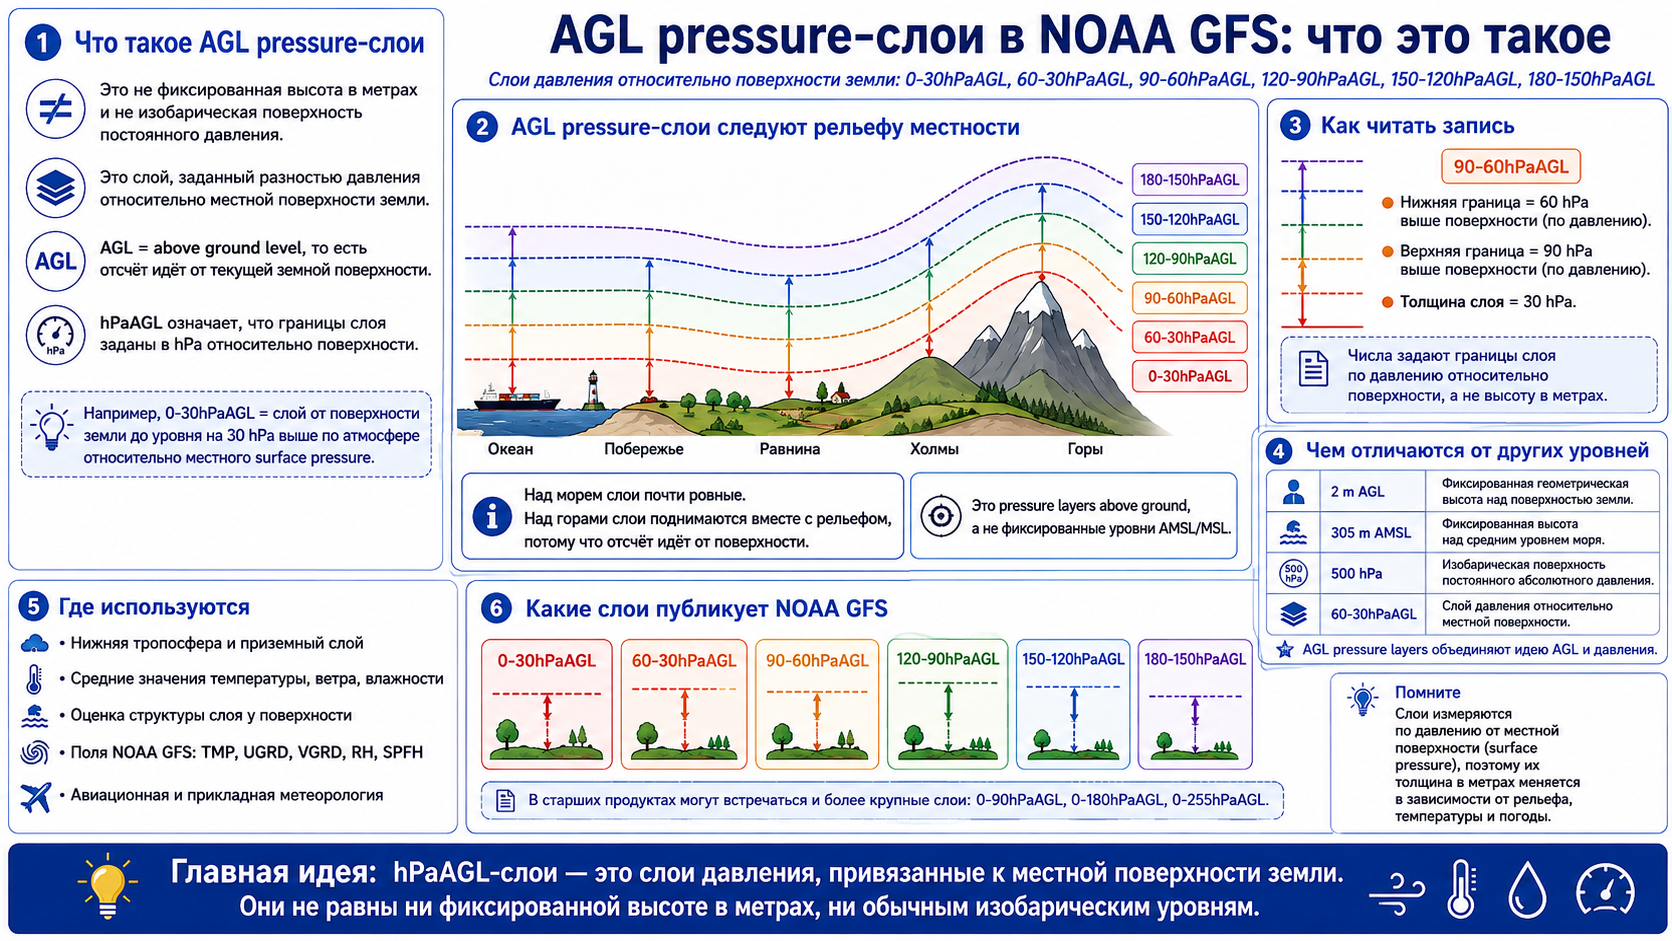
| pressure above ground | Pressure difference relative to the local surface | p = pₛ − Δp. Not metres AGL. At pₛ = 1000 hPa, a 90–60 hPa above-ground layer has boundaries at 910 and 940 hPa. |
| 0 °C isotherm / highest tropospheric freezing level | A temperature surface / the highest freezing level in the troposphere | A profile may cross 0 °C several times. A freezing level alone does not establish icing. |
| Tropopause / maximum wind | Tropopause / maximum-wind surface | Its position is determined by the atmosphere, not fixed metres. |
| Cloud base / top; low / middle / high cloud layer | Cloud boundaries and cloud layers | A surface and a layer are different. In meteorology, LCL means lifting condensation level. |
Full NOAA reference: PV, pressure above ground, sigma, hybrid and all levels
SFC and 2 m AGL: surface and air above it
SFC is the model surface; 2 m AGL is two metres above it. Surface heating by day and cooling by night help explain why TMP can differ between these levels.
Pressure layers above the local surface
In 90–60 hPa above ground, the numbers are pressure deficits relative to pₛ. At pₛ = 1000 hPa the lower boundary is 940 hPa and the upper is 910 hPa. A 30 hPa pressure difference does not imply a fixed thickness in metres.
Two worked examples
All values below are illustrative, not a current forecast. The first target is a flight level; the second is a height above ground, so they require different conversions.
| Level | TMP | HGT |
|---|---|---|
| 250 hPa | 228 K | 10,400 gpm |
| 200 hPa | 216 K | 11,900 gpm |
- FL350 → 10,668 m pressure altitude → p ≈ 238.4 hPa.
- Find 250 and 200 hPa data bracketing the target pressure at the same location and valid time. Interpolate in ln(p): the upper-level weight is approximately 0.213.
- TMP ≈ 225.45 K, or −47.7 °C. Interpolated HGT ≈ 10,719 gpm is a different quantity from the 10,668 m standard-scale altitude.
- Example B: terrain at 600 m AMSL + target 300 m AGL → approximately 900 m AMSL. For this low-altitude illustration, approximate geometric and geopotential heights as equal.
- For HGT values of 730 and 970 gpm and TMP values of 285 and 283 K, the upper-point weight is (900 − 730) / (970 − 730) ≈ 0.708.
- TMP ≈ 283.58 K = +10.4 °C. If the reference pressures are 925 and 900 hPa, logarithmic interpolation gives approximately 907 hPa.
w = ln(p₁ / p) / ln(p₁ / p₂); T = T₁ + w × (T₂ − T₁)
Using this on the portal
- Read the unit and level type first: 850 hPa, 2 m above ground and SFC identify different surfaces.
- Choose a source, forecast time and available level. Open point weather and the vertical profile to compare fields by height.
- For a pressure surface, use HGT from the same model, location, run and valid time. Relate AGL to terrain and its vertical datum first.
- Follow each route-altitude input label. An “m AMSL” field does not accept a flight-level number: FL350 is neither 350 m nor automatically 10,668 m true AMSL.
- If a suitable level or field is missing, treat the result as unknown. Missing data does not mean the absence of a hazard.
Check your understanding
Answer first, then expand each question to check.
Does 850 hPa always mean 1500 m AMSL?
No. Approximately 1457 m is the standard-atmosphere equivalent. A real forecast needs HGT at 850 hPa for the selected point and valid time.
Does the FL equivalent of the 500 hPa surface change when it rises?
No. Pressure remains 500 hPa and its standard pressure altitude remains approximately FL183. The true height of the surface changes.
Does QFE show height above ground along the entire route?
No. QFE uses an aerodrome or runway-threshold reference. Terrain below the aircraft varies independently.
Can any GNSS height minus DEM elevation give AGL?
No. First reconcile the vertical reference systems, including the geoid model if GNSS reports ellipsoidal height.
FL350 equals 10,668 m. Can I put that into an “m AMSL” field?
Not without an additional conversion. Here, 10,668 m is standard pressure altitude; true altitude depends on the atmosphere.
Sources and further reading
Adapted from the supplied “Altitude measurement in aviation” presentation and its illustrated version. Definitions were checked against the primary sources below. Worked examples use fictional teaching data.
- FAA AIM 7-2 — barometric altimeters and pressure settings
- FAA AIM 7-3 — cold-temperature altimeter errors
- ICAO EUR OPS Bulletin 2023_001 — altimeter-setting errors and transitions
- NOAA NGS: GPS height and geoid — ellipsoidal and geoid-referenced heights
- NOAA/NCEP: GFS pgrb2 inventory — parameters and levels in the main GFS 0.25° f003 file
- NOAA/NCEP: GFS pgrb2b inventory — additional parameters and levels
- NOAA/NCEP: GRIB2 Code Table 4.5 — official surface and layer types
- U.S. Standard Atmosphere 1976 — standard atmosphere and the pressure–height relationship